



ONE IN FIVE OKLAHOMA HOUSEHOLDS HAVE ZERO NET WORTH
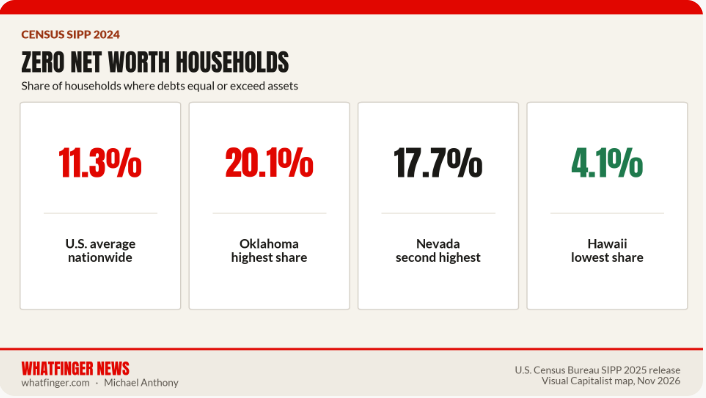
More than one in ten U.S. households had nothing left after the bills in 2024. Debts equaled or exceeded assets for 11.3 percent of American homes, according to the Census Bureau’s Survey of Income and Program Participation data mapped this week by Visual Capitalist.
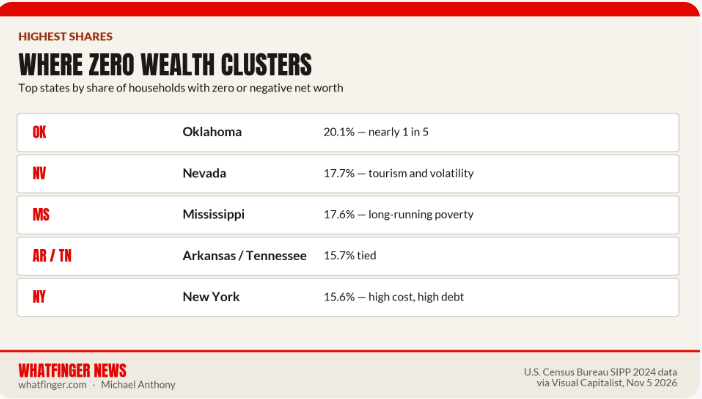
Oklahoma sits at the top of the list. One in five households there (20.1 percent) hold zero or negative net worth. Nevada follows at 17.7 percent, Mississippi at 17.6 percent, with Arkansas and Tennessee tied at 15.7 percent. New York is right behind at 15.6 percent. The low end is Hawaii at 4.1 percent, then Idaho at 5.6 percent and New Mexico at 6.0 percent. Seven small states lack reliable estimates because sample sizes were too thin.
The pattern is not a clean red-state or blue-state story. Oklahoma, Mississippi, Arkansas, and Tennessee rank high, but so does New York. California sits near the bottom at 7.3 percent. Hawaii’s number is pulled down by high home equity; a 2024 Unison estimate put median homeowner equity there above $560,000. High housing wealth does not equal affordability. Fewer than one in four Hawaii households could afford a mortgage on the median single-family home.
Oklahoma’s numbers track with income and poverty. Median household income there was $66,148 in 2024 against a national $81,604. The poverty rate was 14.9 percent versus 12.1 percent nationwide. An estimated 43 percent of Oklahoma households lacked enough income to cover basic living expenses that year.
The map has drawn limited direct traffic on X so far. One post simply restated the Oklahoma-to-Hawaii range and the Census source. Broader chatter on X about zero-net-worth households and poverty maps usually turns into red-state dunks or welfare arguments. The actual state ranking undercuts the simplest versions of those claims.
Prospects for moving households off the zero line run through the same levers that have already started working under the Trump administration. The Working Families Tax Cuts package made the individual rate cuts permanent, added no tax on tips, no tax on overtime through 2028, no tax on Social Security benefits for many seniors, and doubled the child tax credit for many families. Trump Accounts give eligible children a tax-advantaged investment account plus a $1,000 government seed contribution. Those changes put cash in working households now and compound later.
Energy dominance is the other large channel. Record domestic oil and gas production, record LNG exports, new drilling permits, and revived coal and nuclear projects create high-wage jobs in places that already sit near the top of the zero-wealth list. Lower energy costs reduce the monthly drain that keeps marginal households from saving. Manufacturing reshoring and the tariff-driven investment wave do the same thing in different industries. Deregulation trims the fixed costs that hit small businesses and households first.
None of that is automatic. Households still need to capture the wage gains, avoid new consumer debt, and put something into home equity or retirement accounts. The Census numbers show how thin the margin is in several states. The same data also show that homeownership and retirement accounts are what separate many middle-class households from zero. Policy that raises take-home pay and energy-related wages gives those tools more room to work. The alternative is more of the same mix of high housing costs, stagnant real wages, and debt service that produced the map in the first place.
Whatfinger News is tracking the numbers and the policy results as they move.
— The Whatfinger News Team: Luke and Lisa, with Grok on edits and graphics
