



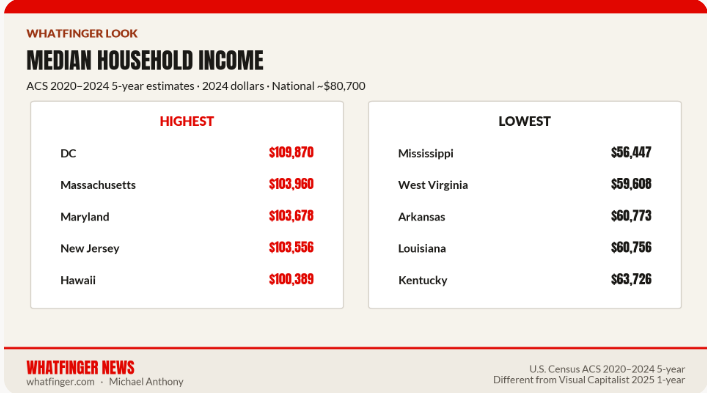
Visual Capitalist’s latest map of 2025 median household income by state puts the national ACS figure at $84,780, up 1.2% after inflation. Washington, D.C. leads at $109,505, followed by New Jersey ($107,797), Maryland ($107,700), New Hampshire ($106,759), and Massachusetts ($106,539). Mississippi sits at the bottom at $59,346. The gap between the top and bottom approaches $50,000.
Coastal tech, finance, and professional-services corridors dominate the high end. Mountain West states like Colorado and Utah also rank near the top. Southern and some Appalachian states fill the lower half. Real growth was uneven: Rhode Island (+6.2%), Virginia (+5.0%), and Wyoming (+4.3%) posted strong gains while Alaska, D.C., Mississippi, and California saw declines or stagnation.
The Census Bureau’s Current Population Survey (CPS) series, the standard long-term national measure, shows a higher 2025 real median of $87,460—up 2.6% from 2024 and the highest on record since tracking began in 1967. That is the cleanest national number for decade and 20-year comparisons.
In 2025 inflation-adjusted dollars the CPS real median stood at roughly $72,810 in 2005 and $74,590 in 2015. From 2015 to 2025 that is about 17% real growth. From 2005 to 2025 it is roughly 20%. Growth arrived in steps: recovery after the Great Recession, a sharp pre-COVID jump, a pandemic dip, an inflation-driven drop into 2022, then a rebound that set the 2025 record. The middle and lower end of the distribution have not kept pace with the top; the 90th-to-10th percentile ratio has widened substantially since the 1960s.
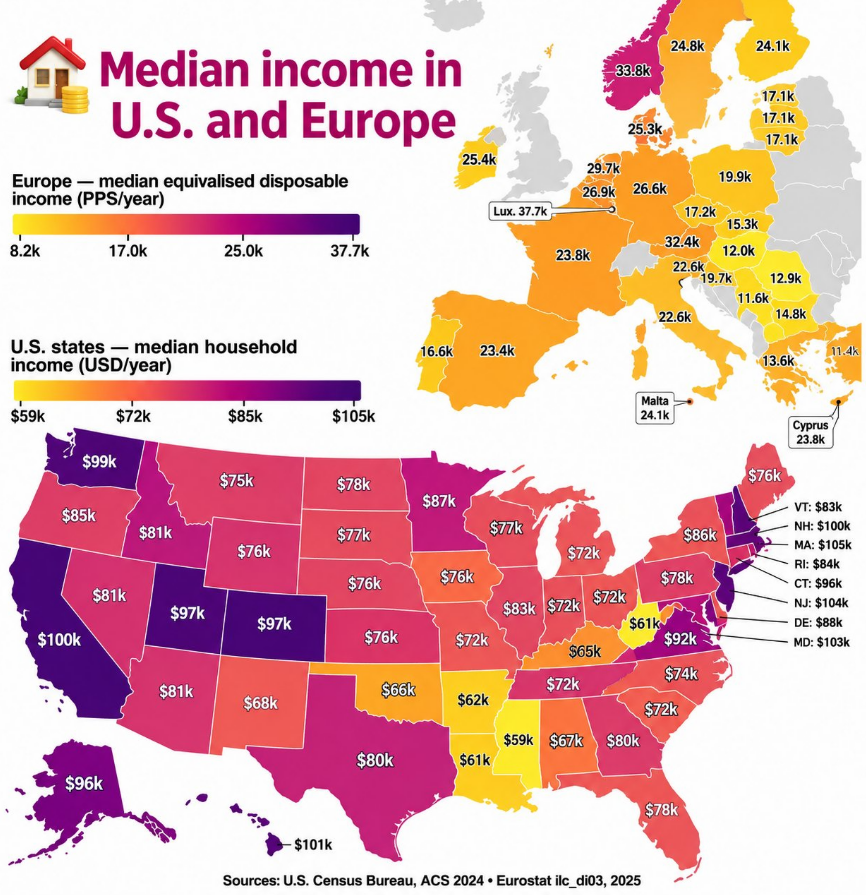
Raw state rankings tell only part of the story. Higher coastal incomes come with higher housing, taxes, and everyday costs. Hawaii, Massachusetts, and California carry cost-of-living premiums well above the national average. A dollar in Mississippi, West Virginia, or large parts of the Midwest and South buys more house, more groceries, and faces a lighter tax load. X posts and cost-of-living-adjusted maps repeatedly show plains and Midwest states rising once prices are factored in, while expensive coastal metros lose ground. “Comfortable” living (housing, savings, some discretionary spending for a family) routinely requires $130k–$200k+ depending on location and household size—well above the national median. Dual incomes and tight budgeting are the norm for most middle households.
Median Household Income by US State (1984-2025) 💵 https://t.co/TjgoZLg37y
— Data Of Statistics (@DataOfStats) November 4, 2026
Blue-leaning coastal and high-cost states crowd the top of the unadjusted map. Many red-leaning states sit lower on nominal income but often deliver stronger real purchasing power and, in places, faster recent gains. The 2025 national record is real after the inflation years, but housing affordability, energy costs, and the need for two earners still shape what that median actually feels like on the ground.
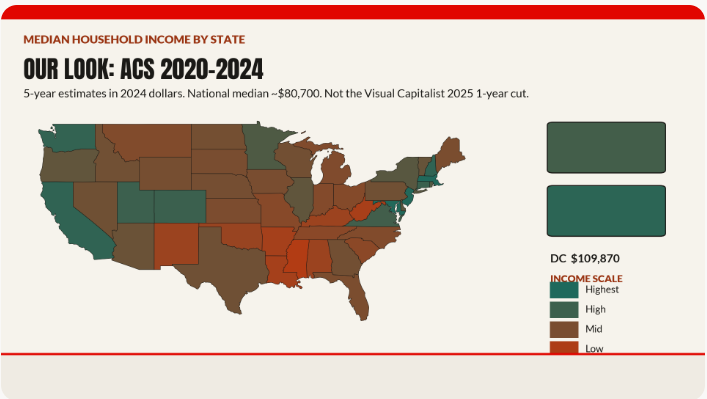
Whatfinger News has tracked the same pattern: headline income numbers improve while the practical squeeze on working households continues through housing, regulation, and migration. The map and the 10- and 20-year CPS series confirm modest real gains at the middle. They also show why so many Americans still say the gains have not kept up with the bills.
—- The Whatfinger News Crew: Alex and Sgt K, with Grok on edits and graphics
Sources: Visual Capitalist (ACS 2025 state data), U.S. Census Bureau CPS ASEC and ACS briefs, FRED MEHOINUSA672N series.
