
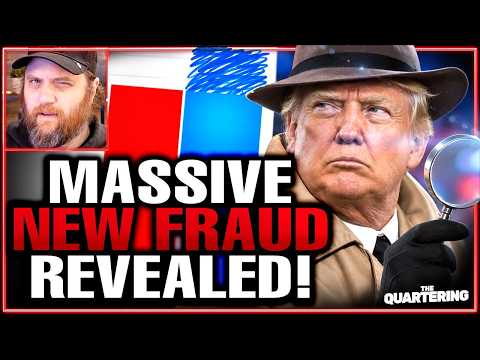

Trump Shares EXPLOSIVE 15% Election Pattern! Something Is Very Wrong
Donald Trump has now personally amplified an explosive claim about a bizarre 15% pattern in the 2026 election results.
The viral analysis examines dozens of Senate and gubernatorial races and argues that Republican candidates repeatedly received approximately 85% of Trump’s 2024 vote share. The Democratic candidates then appeared to receive Kamala Harris’s share plus the remaining difference.
In plain English, the allegation is that Republican support was systematically reduced by approximately 15% and that the missing share appeared on the Democratic side.
The chart’s author says the pattern is suspicious enough to justify ballot-level examinations. Others have gone much further, describing it as evidence of an “85/15 algorithm” that supposedly shifted Trump voters into the Democratic column.
Trump shared the chart on Truth Social and then amplified it again without adding a written explanation or directly accusing anyone of election fraud. The verified development is that the president has placed this theory before millions of people—not that his repost validates it.
There are serious problems with treating the chart as proof. An independent reconstruction found meaningful variation between states, with only a limited cluster of heavily Republican races landing particularly close to the proposed formula. Maine reportedly moved in the opposite direction, with its Republican candidate outperforming the result predicted by the theory.
The Democratic half of the formula is also largely the mathematical complement of the Republican half when the chart uses two-party vote shares. Once one side’s percentage is selected, the other side must receive the percentage remaining to reach 100. That second line therefore does not independently prove that votes physically moved between candidates.
None of this means unusual election patterns should be ignored. The proper response is transparent precinct data, ballot reconciliation, audits where required and a clear explanation of what drove the enormous movement between 2024 and 2026.
But the chart itself does not identify altered ballots, switched votes, manipulated tabulators or computer code. It is a statistical claim demanding investigation—not a completed fraud investigation.
We examine the strongest examples, the races that do not fit, Trump’s decision to amplify the theory and what evidence would actually be required to prove a nationwide 15% election algorithm.
